The collected data must be high-quality as it’s the hard evidence that the aircraft is ready for its intended civil or military application.
One often overlooked aspect of flight test data quality is video encoding. Video data acquisition is crucial as it provides a visual record of what's happening during a flight, giving context for the data from other sensors. Video monitors aircraft surfaces, landing gear, store deployment and are also used to observe pilot actions and record glass cockpit display information. However, with limited space to send information to ground stations during flight, how do we balance high video quality with manageable data rates?
Historically, optimizing video quality involved subjective "eyeball tests" – watching sample videos and making qualitative judgments. While intuitive, this approach is prone to inconsistency and misses subtle differences. That's where quantitative video quality metrics come in, offering a scientific way to optimize encoder performance.
Understanding Video Quality Metrics
Our focus here is squarely on video quality, not image quality. Image quality is influenced by the quality of the camera sensors, lenses, etc., while video quality is primarily influenced by the video encoder’s settings and features. Factors like resolution (1080p, 4K), frame rate (30, 60 fps), compression standard (H.264, H.265), target bitrate, and key frame settings all play a vital role.
A key concept is the Group of Pictures (GOP) setting, which is the ratio of I-frames to P-frames. I-frames (or key frames) contain a full image, while P-frames store only the differences between the current frame and the previous frame. A higher GOP means lower bitrate, but rapid motion can lead to data loss or "blackouts." Striking the right GOP balance is crucial to keeping video data rates low without losing critical data.
The television industry utilizes "full reference quality metrics" that compare the original and compressed video to move beyond subjective assessment. The three most used metrics are:
Peak Signal-to-Noise Ratio (PSNR): A classic metric that compares pixel values between the original and compressed image. Lower Mean Squared Error (MSE) means higher PSNR, indicating less error.
Structural Similarity Index Measure (SSIM): Widely considered superior to PSNR, SSIM goes beyond absolute pixel differences to compare luminance, contrast, and structural elements. It's more aligned with the human perception of quality.
Video Multi-Method Assessment Fusion (VMAF): Developed by Netflix, VMAF combines multiple elementary metrics using a machine-learning algorithm, intelligently balancing their strengths to provide a highly accurate overall score that correlates strongly with human perception of video quality. This makes VMAF our top pick for robust video quality assessment.
The Challenge of Sourcing Test Data
To accurately assess encoder performance, you need a dynamic, challenging source video with varying motion and lighting conditions. Standard movies or TV shows often fall short due to their lower frame rates and pre-compressed nature.
Our team came up with an interesting solution: video games! Modern games, like FromSoftware's Elden Ring, offer uncompressed, high-frame-rate (1080p 60fps) video with user-controlled motion and dramatic lighting shifts. We can generate the perfect stress test for our encoders using open-source software like OBS (Open Broadcaster Software) to capture raw video directly from the graphics card. For example, slow, methodical movements suddenly interrupted by explosive effects, which put serious pressure on the encoder.

Figure 1: The video game “Elden Ring” was used to generate the source video
Practical Application: Test Setup and Results
Our test bed included a video module for compression, a network recorder for data storage, and a video regeneration device to split raw and compressed data. We captured videos at 1080p 60fps with H.264 encoding and a GOP of 60, testing bitrates from 3 to 20 Mbps.
The results, as measured by PSNR, SSIM, and VMAF, clearly demonstrated that higher bitrates, unsurprisingly, generally correlate with higher quality. In particular, VMAF scores showed a significant jump from 3 to 6 Mbps, with diminishing returns beyond 12 Mbps.
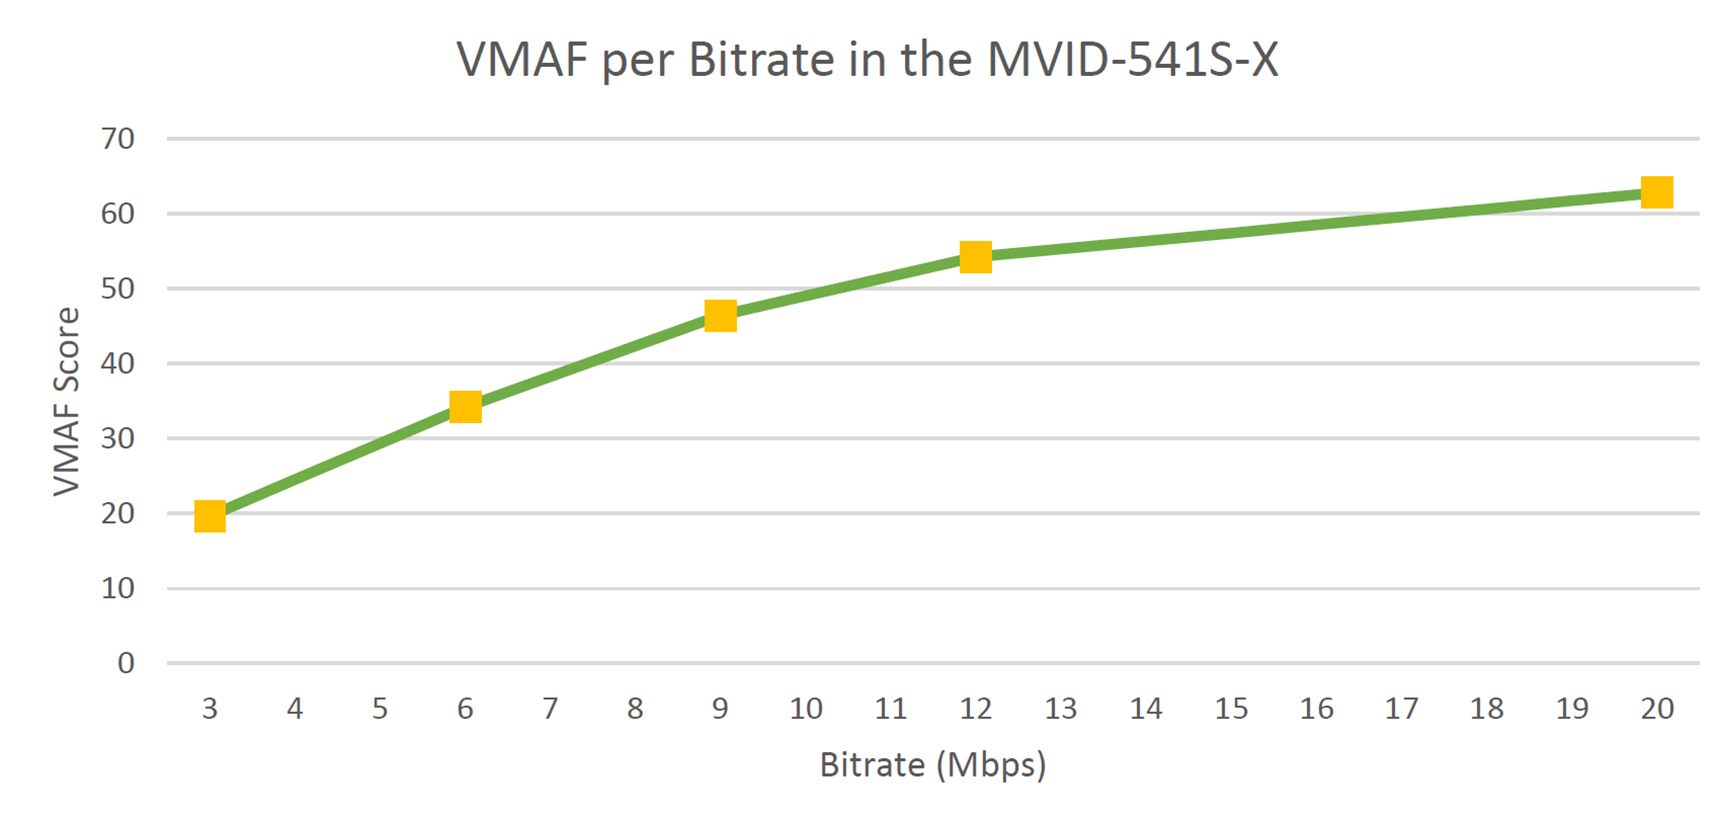
Figure 2: The results showed bitrates above 12 Mbps showed diminishing returns
Crucially, our frame-by-frame VMAF analysis highlighted a key insight: the video content heavily influences the quality score. Moments of significant change – be it motion or lighting – inevitably lead to temporary dips in the encoder's performance.
The Takeaway for Flight Test Professionals
While the target of video quality will always be the human eye, quantitative scoring offers an invaluable tool for benchmarking and optimizing your flight test video acquisition. By running tests with source videos similar to your real-world scenarios, you can create a matrix of scores that helps you fine-tune settings like GOP, frame rate, and resolution to achieve the optimal balance of quality and bitrate.
For our specific test setup and challenging video source, we found that 6-12 Mbps provides excellent 1080p 60fps video quality without overwhelming data acquisition bandwidth. For less dynamic scenes, lower bitrates may suffice.
Looking ahead, the goal is to further refine these tests by using real-world camera footage or flight simulators to truly understand how to minimize bitrate while maximizing quality, giving you the most "bang for your buck" in flight test video.
To learn more about the tests and data collection, check out the in-depth white paper.

Ben Kupferschmidt
Sr. Manager, Desktop Software / Product Line Manager, Ground Solutions
Ben is based in Newtown, PA, and heads product management for the Aerospace Instrumentation software and ground station teams in Curtiss-Wright.